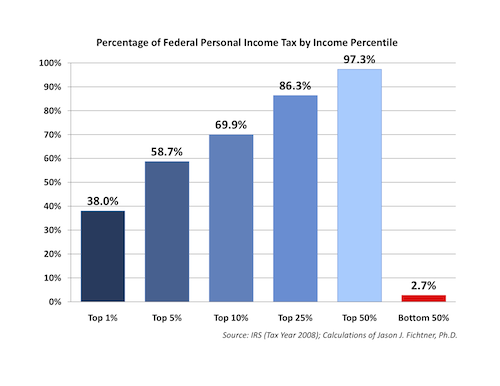
The chart above comes from the Mercatus Center at George Mason University. It illustrates the
breakdown of federal personal income taxes:
This week, Mercatus Center Senior Research Fellows Veronique de Rugy and Jason J. Fichtner chart the fairness of the biggest source of federal revenues – the federal income tax. This bar graph uses data from the Internal Revenue Service to break down total federal income tax revenues by the earnings percentiles of the Americans who paid them. The top earning 1% of Americans (or 1.4 million returns) paid 38% of taxes while the Americans at the lower half of the income spectrum (or 70.0 million returns) paid 2.7% of total federal personal income taxes.
According to the Tax Policy Center, this tax season, an estimated 45% of tax units will pay no federal income taxes. In 2009, federal non-income taxpayers were distributed throughout the earnings spectrum, with 26.3% of tax returns reporting less than $10,000 paying no income tax, 29.1% of those making between $10,000 and $20,000 paying no income tax; the remaining 44.6% of Americans not paying income taxes were distributed throughout all cash income levels.
In fact, taxpayers with the highest 400 AGIs (who made on average $345 million in 2007, the majority of which came from capital gains which are taxed at a maximum rate of 15%) were taxed at an average federal income tax rate of 16.62 percent, with effective tax rates within this group ranging from 0% to 35%.
These statistics signal a tax system that is not only progressive, but one that is convoluted and unfair.


No comments:
Post a Comment